Start the iteration
Identify the data groups
CAST Imaging provides automatic views of the full Data call graph to help identify the components involved with a given table and the type of links: Read or Write.
The call graph of a business function from the UI to the data is represented in Imaging by a Transaction, this is a to-be microservice as per the Strangler fig pattern.
From the list of relations between data sources and transactions, you can pinpoint the loosely coupled data, having the lesser adherence to the transactions. Those will be the starting point of an iteration.
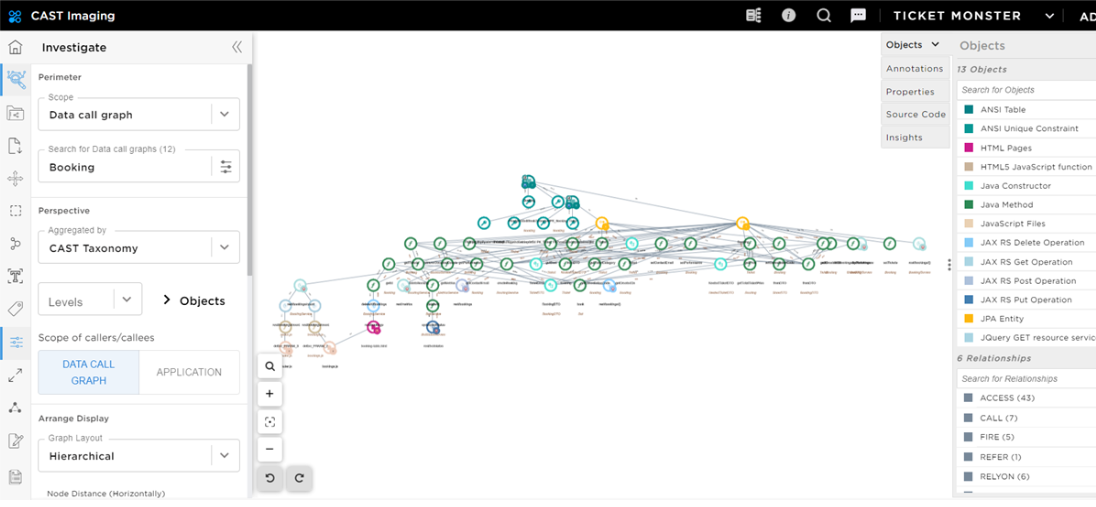
Example of a non-suitable selection for a new microservice
Let’s start with the table named Venue: it stores the locations for an event such as theaters, operas, stadiums or conference centers.
Venue locations are not expected to evolve very often, so a static database (in-memory or NoSQL database) should be a good candidate for a target micro-service with the Venue table.
Select the Venue table in the Data Call graph menu (in the left hand panel) and display the Objects involved with the table.
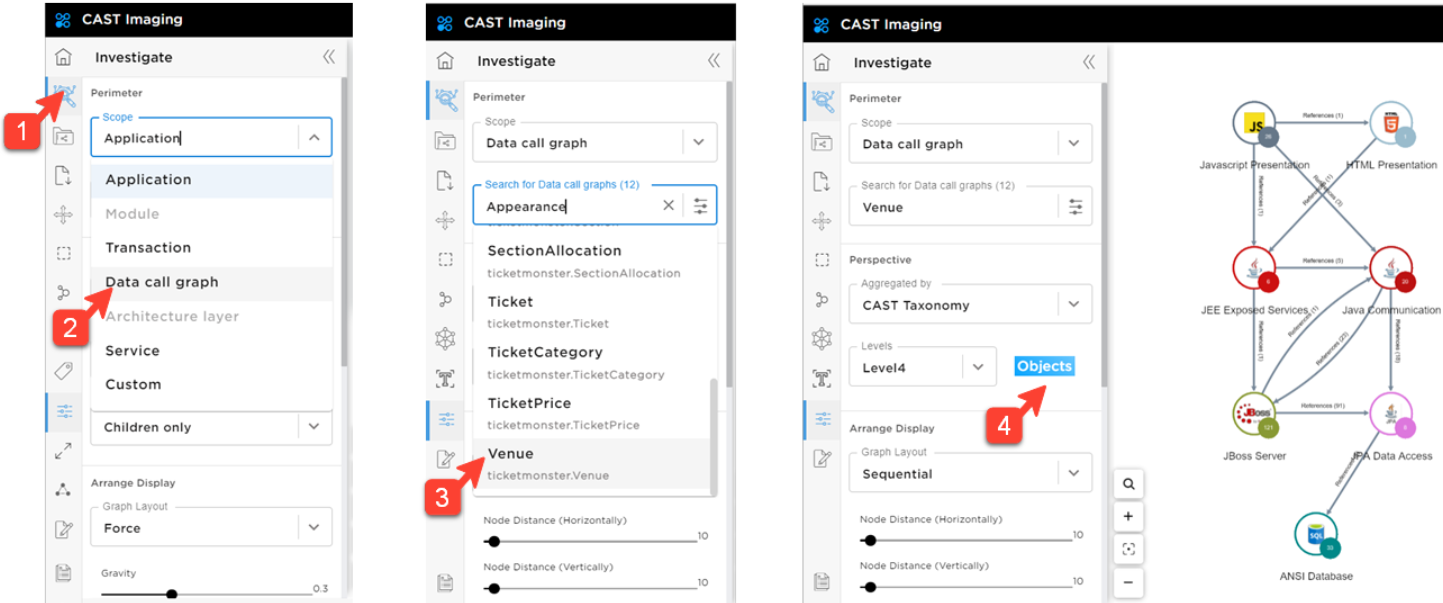
You visualize all components depending on the tables and you can filter the object types displayed on the right hand side menu to make the view more readable.
You can also play with the graph layout to improve the rendering (Force or Sequential layouts are usually a good fit).
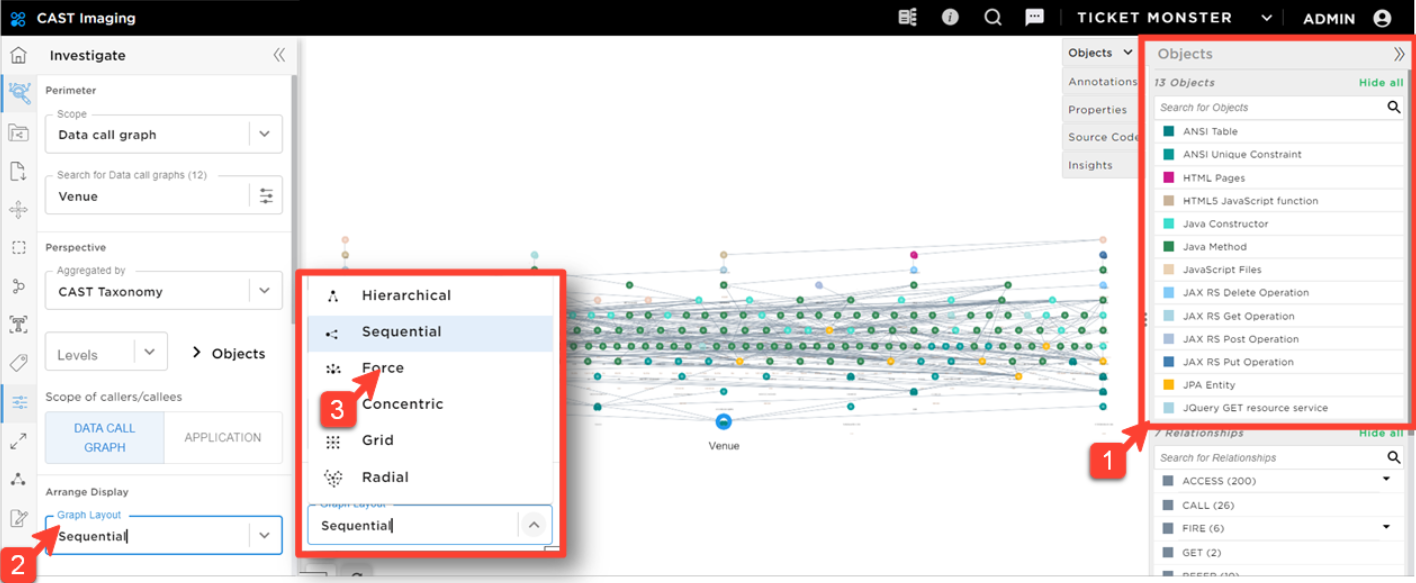
You observe that the Venue table is used by:
- Many Java Methods are involved in the graph: the cross-dependencies will increase the level of impact if we isolate those components.
- 7 other tables are linked to this table: there is not a clearly defined data group.
- 15 JAX-RS operations and 9 JavaScript Files: moving this table in another database will require modifying all those services.
Considering the impacts of changing the code to isolate the Venue table compared to the value brought by the table (which is actually more of a storage service than a business-critical service), this table is not a good candidate for a new microservice.
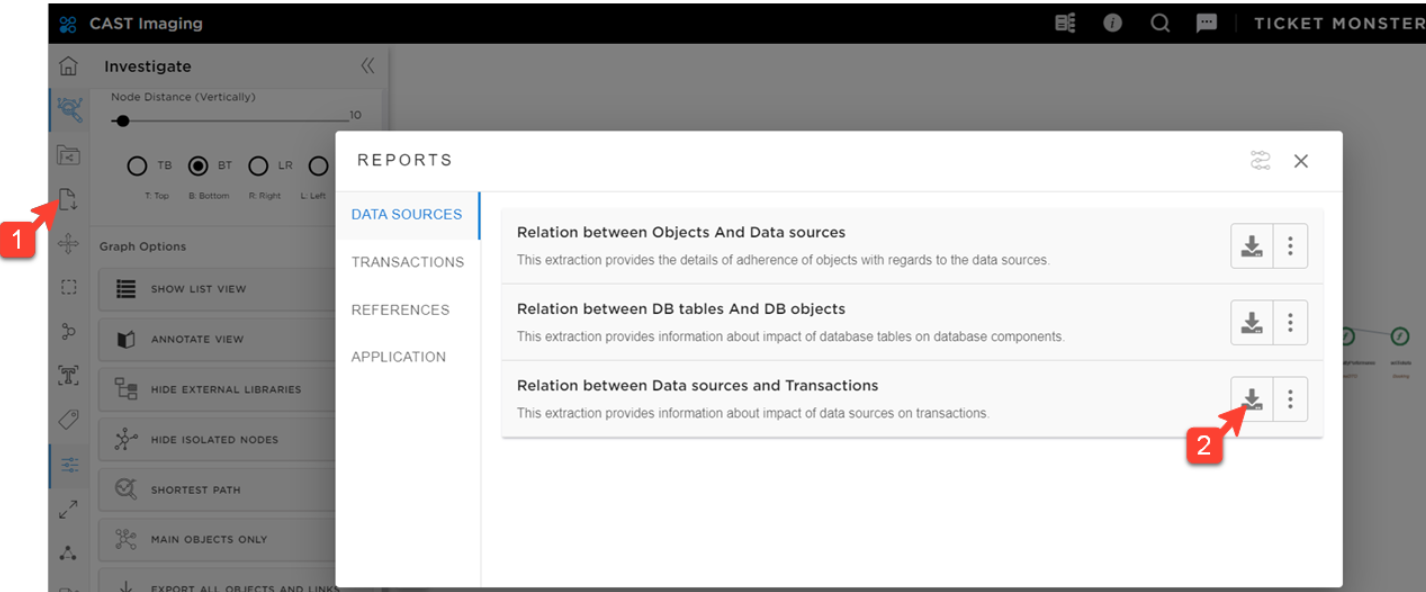
Dependencies report between data sources and transactions
A relationship report between tables and transactions is key for a faster identification of the candidate tables for the iteration.
You can use the report generated by CAST Imaging to get such a pivot table very quickly.
Relationship reports between data sources and transactions can be generated from the CAST Imaging Report section in the left hand side menu.
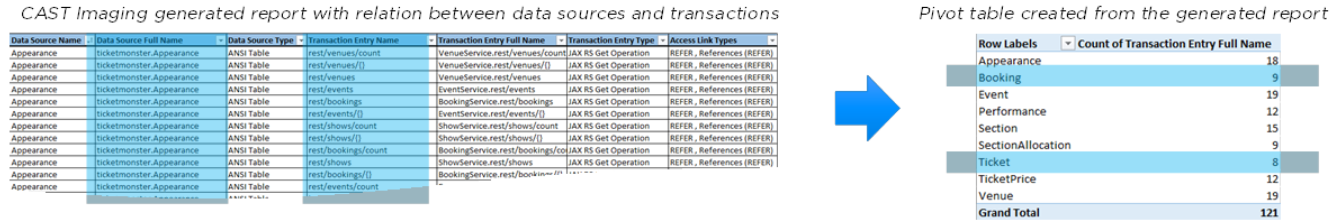
Below is the pivot table for Ticket Monster tables that will help us identify the next data sources to investigate.
The best candidates for the iteration seem to be the Booking and Ticket tables which are loosely coupled with the transactions (compared to other tables):
Investigating candidate tables
You will now choose the Booking table in the data call graph section (left hand side menu).
Those are business critical tables dealing with the management of booking.
You see a lesser number of Java Methods involved, with one dependent table named Ticket which is also a loosely-coupled data.
You have identified the tables Booking and Ticket as the best candidates to start the iteration. You now need to investigate the user-interface and implementation layer depending on those tables to list the impacts of re-writing the business function in a microservice.