Replace a custom logging layer
Objective: A dedicated logging Service such as Amazon CloudWatch needs to be integrated to make monitoring and optimization easier on the target platform.
But how to identify the objects to be replaced ? What are the impacts of their replacement ? How to follow gradually that we break all bridges to the legacy logging layer ?
Documentation: This exercise will utilize the CAST Imaging Custom Aggregations feature.
Identify the components to be modified
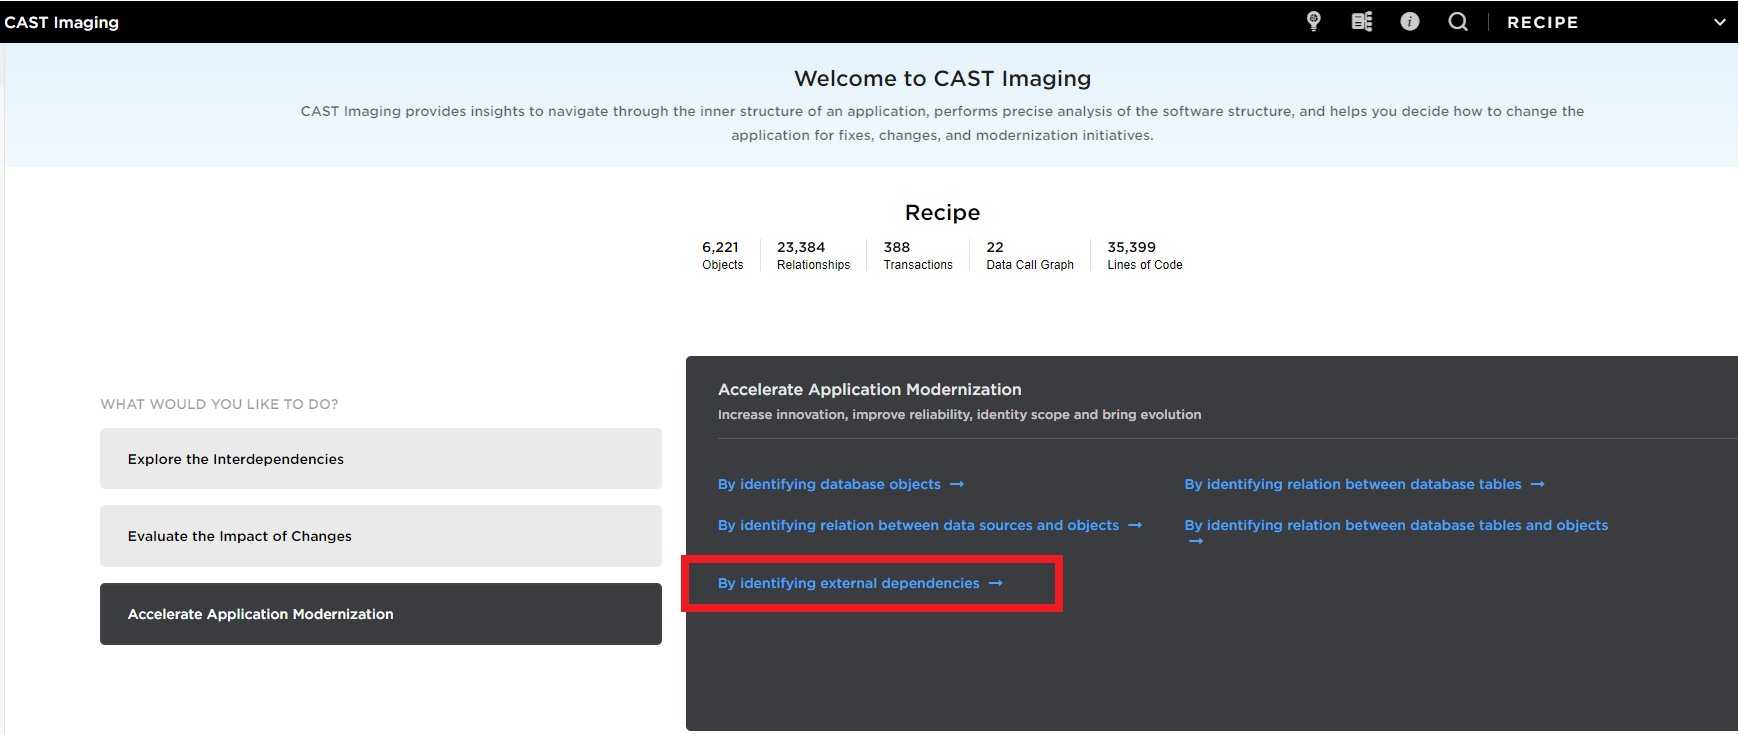
Select the application Recipe and choose Accelerate Application Modernization > By identifying external dependencies
 The application external dependencies, APIs, frameworks will be displayed with the direct callers from the application custom code.
You can see that the API System Diagnostics is used in the application, this is a .NET logging framework.
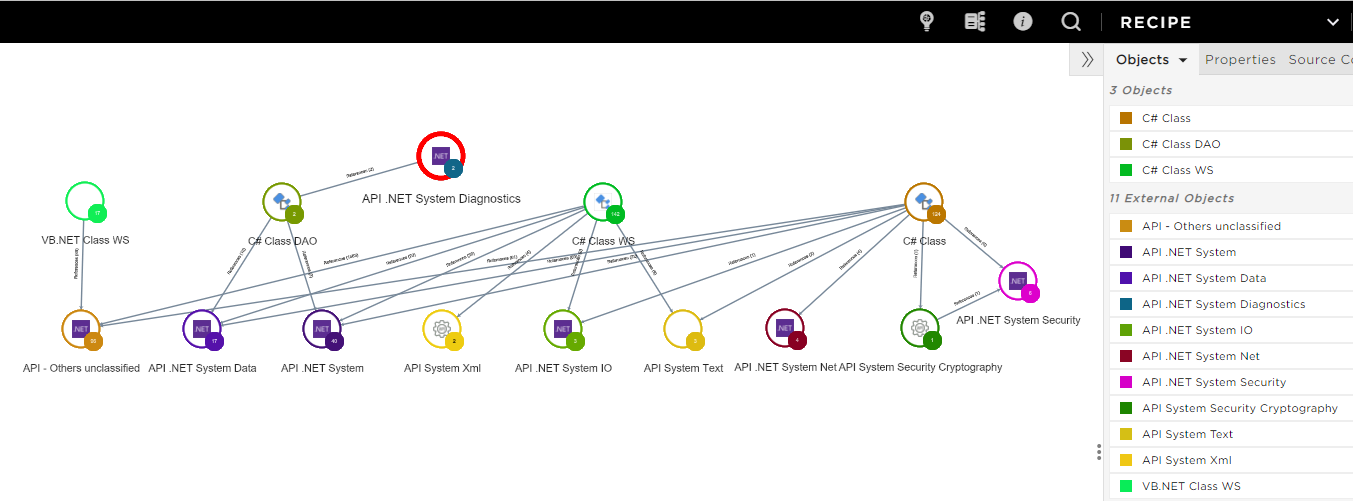
Double click on the edge between API System Diagnostics node and C# Class DAO to see which components are using the API. The C# Method WriteToEventLog is calling the logging API.
When you right click on the C# Method to add the callers, no object is displayed, meaning this C# Method is actually not called by any other code.
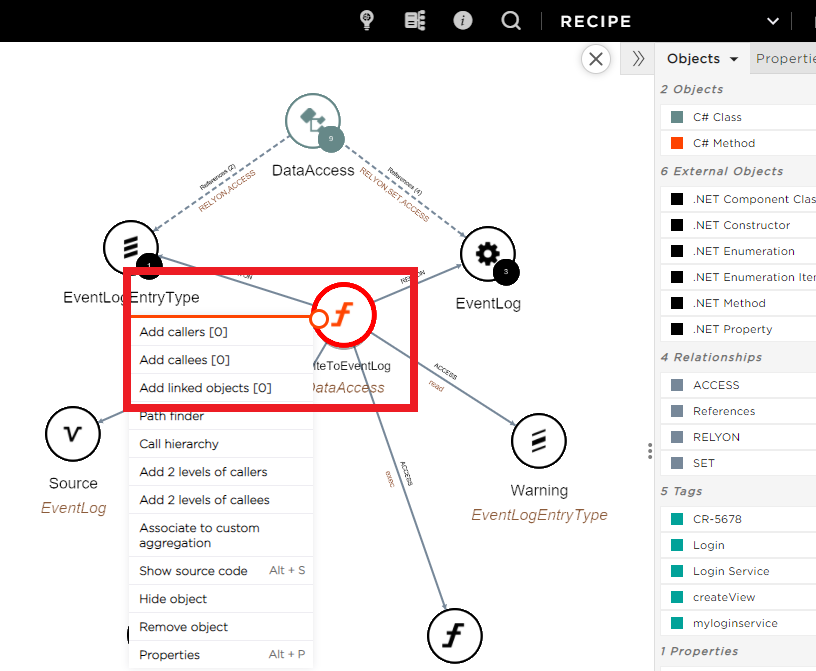
📝 You just found a logging API bundled in the application libraries but it is actually not referenced. You need to look for another logging mechanism in the application custom code.
Visualize the adherence
Let’s search for other source code components that would be handling the logging.
 You can use the Search feature to look for any component in the application which name ends with “Log”.
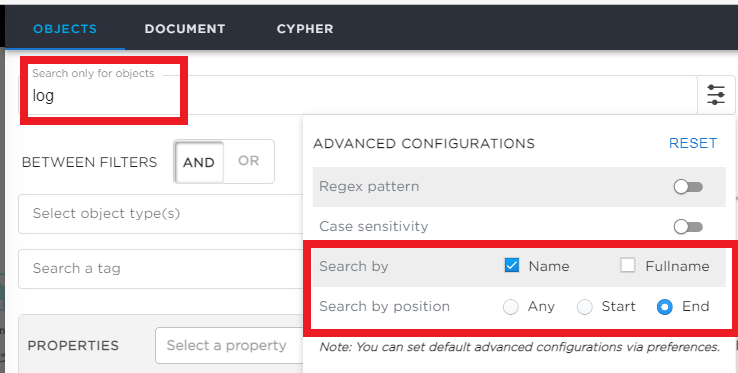
You see several object types including database tables.
📝 Recipe application is in fact using a custom logging mechanism through database tables. You will regroup the components that access those tables.
Those components would need to refer to the new logging service instead of calling the tables.
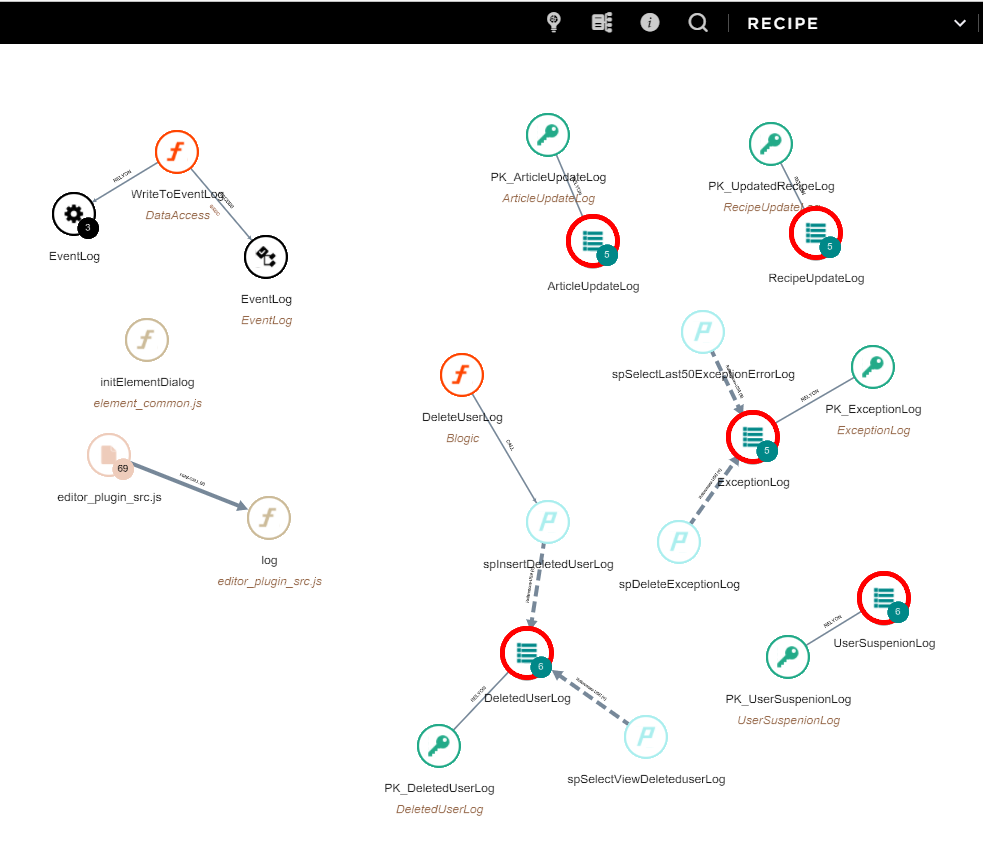
You will now regroup the objects participating int he logging mechanism to display the adherence wiht the rest of the application.
Select the application Recipe then click the Custom Aggregation from the top Menu bar.

CAST Imaging proposes a number of built-in nodes grouping components by technology, layer type, etc. Custom aggregation allows you to create your own nodes by aggregating the application components using your own criterias. This is useful to visualize the adherence with the rest of the application components to prepare the TO-BE architecture or to identify gaps or strong coupling between functional groups.
Select Create new aggregation view and start by choosing a name. Then choose the option Populate the aggregation using “CAST Taxonomy”.

The aggregation is then pre-populated with a list of nodes representing the technologies of the application.
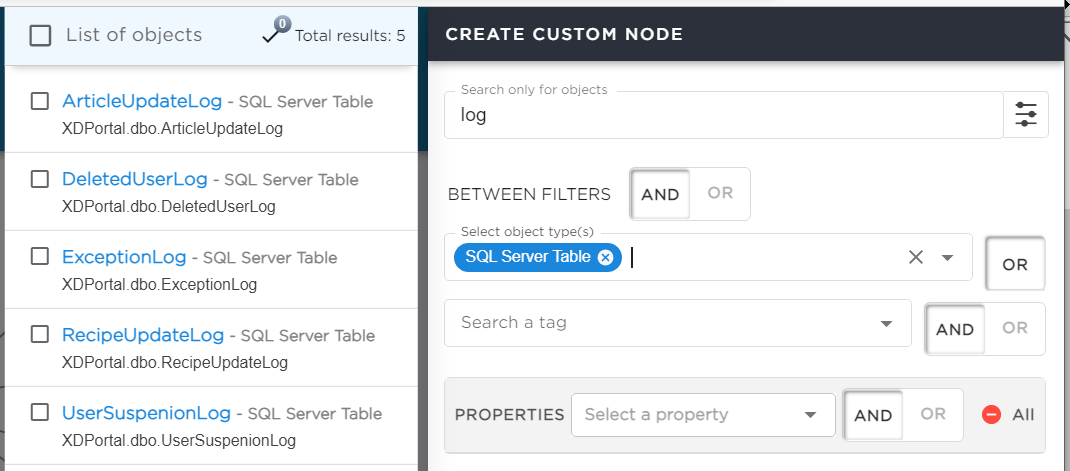
Click on Create a new node, this will switch to the Search window, allowing you to select the components to be part of this new node.

Here we will search for SQL Server tables and SQL Server unique contraints which names contain “log”. Select all the results and click on Associate, this will create a custom node that you can name Logging Tables.
You can now see the adherence between the Logging tables and the rest of the application.
Finally, click on Publish to make the work visible to others for contribution.
Custom aggregations can be published to be shared with the application team for contribution.
Publishing the custom aggregation will make it read-only in the Custom Aggregation window and visible to users of the same application in the standard window.
Identify the impacts
Now exit the Custom aggregation window (Close button on the top left of the window).
You will now visualize the newly created aggregation by changing the Perspective in the left hand menu and choose the name of your aggregation view.
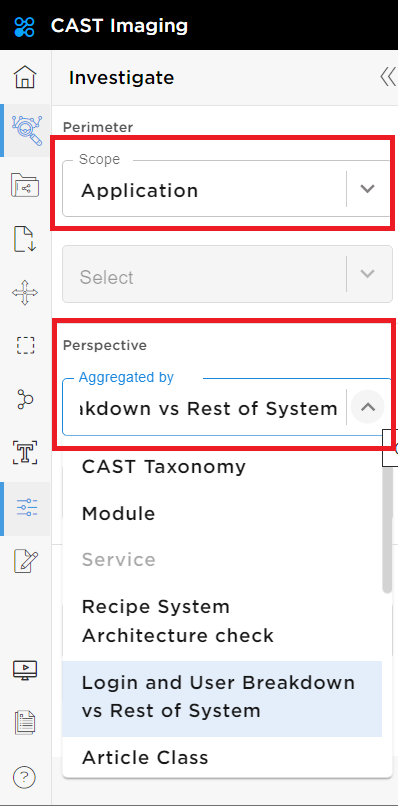
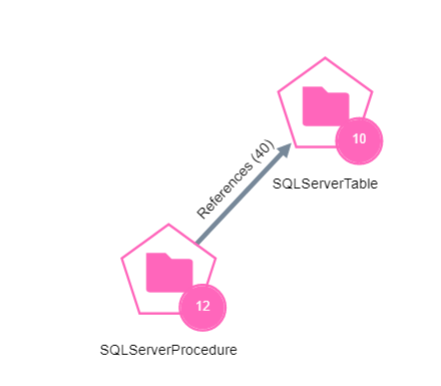
Double click on the Logging Tables node to visualize the content. You can see SQL Tables and the SQL Procedures calling them.
You will now add the SQL Server Procedures that are calling Logging Tables into a new custom node by fllowing the below steps:
- Double click on the hexagon SQL Server Procedures.
- Select the 12 SQL Server Procedures (Ctrl + Left Click).
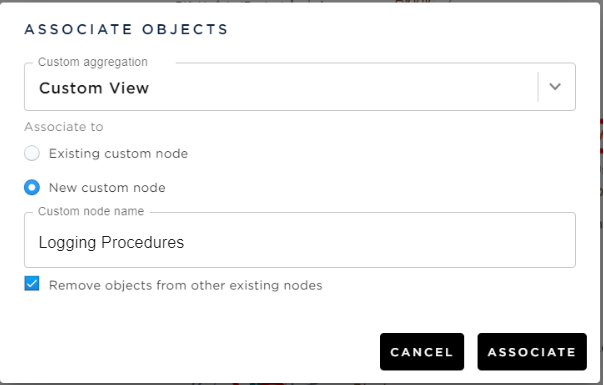
- Right click on Associate to custom aggregation.
- Select the name of your custom aggregation created earlier and select the option New custom node and name it “Logging Procedures”.
- Make sure to check the box Remove objects from other existing nodes
- Click the Associate button
Keep the SQL Procedures selected and right click to Add Callers, so you can see the components refering to the logging procedures.
Only one C# Class is using those procedures named Blogic.

📝 This means that the references to the logging Procedures in Blogic class will need to be replaced by calls to the new logging mechanism. Add the Blogic class to a new aggretation node following the same steps than before.
Close the view and refresh the browser to see the full picture.
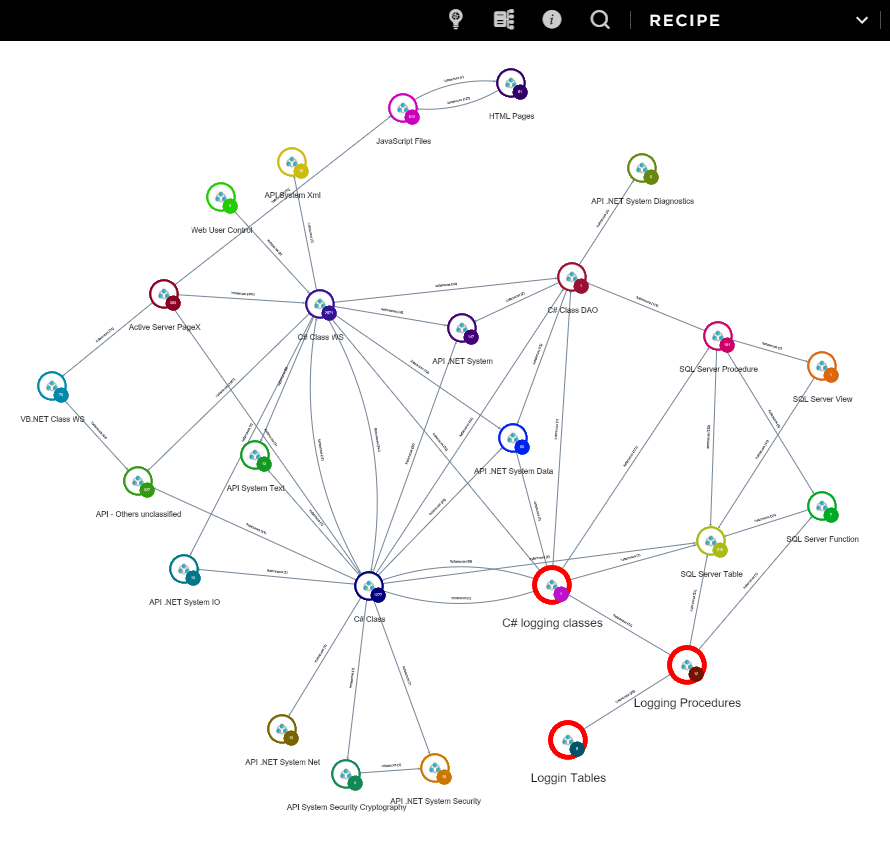
The logging nodes will be displayed and you can now visualize the adherence between the existing components in charge of the logs and the rest of the application, which will help you identify which components to modify when replacing this custom logging layer by a Cloud Logging Service such as AWS CloudWatch.
